The sellers are the faithful: two-thirds of coins hitting exchanges are long-term holders taking a loss
With bitcoin testing $63,000, the coins flowing to exchanges overwhelmingly belong to holders who bought more than 155 days ago — and most are selling underwater. Historically, that pattern shows up near bottoms, not tops.
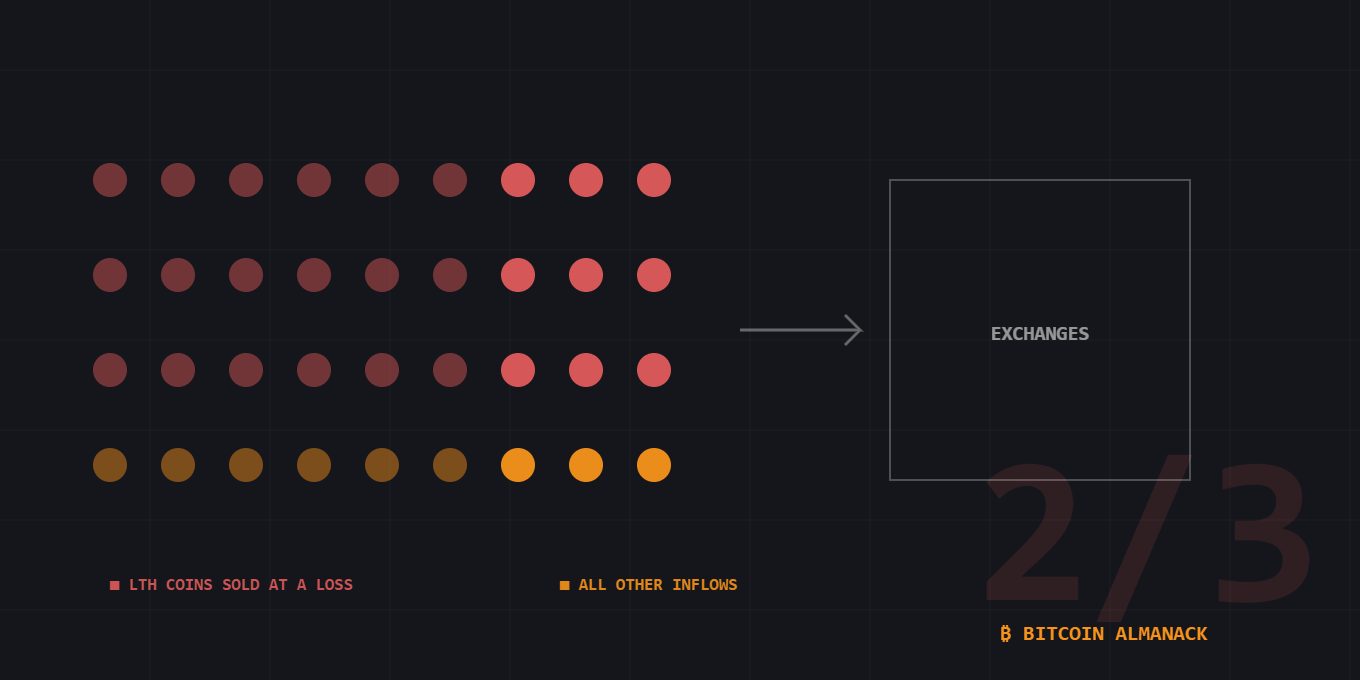
Who is selling: the mix of coins arriving at exchanges this week. Illustration: Bitcoin Almanack.
The most interesting thing about this week's slide back under $63,000 isn't the price — it's who is doing the selling. Per on-chain data reported by Decrypt on Friday, roughly two-thirds of the coins moving onto exchanges belong to long-term holders, the cohort whose coins haven't moved in at least 155 days. And most of those coins are being realized at a loss.
That combination is rare by construction. Long-term holders are, statistically, the market's most stubborn cohort — the same wallets that sat through last October's run to an all-time high near $128,200 without flinching. When they sell into weakness, underwater, in size, it usually means the market's most patient money is finally exhausted. On-chain analysts have a blunt name for it: capitulation.
The chain shows the mechanics plainly. Every coin's cost basis can be approximated from the price on the day it last moved, so a coin last touched in Q4 2025 — when bitcoin traded above $100,000 — arriving at an exchange today is being sold roughly 40% underwater. Those are the coins showing up now, alongside Wednesday's 2017-era whale awakening, which remains the week's single largest dormant-coin move at $383 million.
What makes the signal worth watching rather than fearing is its track record. Waves of loss-realization by long-term holders clustered near the 2015 floor, the 2018–19 trough, and the late-2022 low — not at tops. Sellers at a loss eventually run out of coins to sell; the question is only how long the flush takes. The counterpoint: the same data says demand is soft. These coins are being absorbed slowly, in a market where ETF flows only just turned positive and sentiment has been pinned in extreme fear for most of the summer.
None of this predicts next week. What it establishes is the character of the current market: the sellers are tired holders, not fresh leverage, and the buyers are patient but few. That's a bottoming process, whether or not this is the bottom.
BITCOIN ALMANACK ANALYSIS
Coins arriving at exchanges this week — who's selling, and at what
LONG-TERM HOLDERS SELLING AT A LOSS~66%
ALL OTHER INFLOWS (SHORT-TERM, PROFIT-TAKERS, INTERNAL)~34%
Share of exchange-inflow volume, week of July 13–17 (approx.) · LTH = coins unmoved ≥155 days · Data: on-chain analytics via Decrypt · Chart: Bitcoin Almanack
WHY IT MATTERS
Price tells you what happened; the chain tells you who did it. A market where the sellers are exhausted long-term holders realizing losses looks very different from one where new buyers are dumping — the first has historically resolved upward once the flush completes. For anyone accumulating, cohort data like this is the strongest argument for a schedule over a timing call.
What to watch next
1.The loss-share trend. Capitulation waves end when the share of coins sold at a loss rolls over; a falling share with a stable price is the classic bottom fingerprint.
2.Exchange balances. If inflows keep rising while balances build, the flush has further to run; absorbed inflows with flat balances mean buyers are meeting the sellers.
3.The $61,800–$63,000 band. The same support the price desk flagged — heavy loss-selling into a level that holds is accumulation by definition.
Frequently asked questions
What is a long-term holder in on-chain analysis?
By the standard convention, any coins that haven't moved in 155 days or more. Statistically, coins that cross that age are increasingly unlikely to be spent — so when they do move to exchanges in size, analysts pay attention.
Is long-term holder selling bearish?
In the short run it adds supply. But historically, waves of long-term holders selling at a loss have clustered near cycle bottoms — 2015, 2018–19, late 2022 — because they mark the point where the most patient money finally gives up. It's a capitulation signal, not a trend signal.
How do analysts know coins are being sold at a loss?
Every coin's last on-chain move is timestamped, so its cost basis can be approximated from the price on that day. If a coin last moved when bitcoin was above today's ~$63,000 and moves to an exchange now, it's very likely being realized at a loss.
SOURCES & DATA
Decrypt — "Bitcoin Tests $63K as Long-Term Holders Keep Selling at a Loss" (Jul 17, 2026) ↗
mempool.space — on-chain transaction and block data ↗
CoinDesk — bitcoin price and market data ↗
Cohort shares are approximations from third-party analytics as of ~1 PM ET. See our editorial process.
Derek Chu
On-Chain Analyst. Former quant developer; runs his own full node and UTXO-level analysis pipeline, on the chain since 2019.
MORE FROM THIS WEEK
Bitcoin's slice of the pie holds at 56% while everything else falls faster
MARKETS
Bitcoin slips under $63K as the midweek breakout unwinds
MARKETS
Bitcoin lands on TikTok Shop: Fold's gift card puts BTC next to the phone cases
ADOPTION
A whale wakes after 8.5 years: dormant 2017-era wallet moves $383M in bitcoin
ON-CHAIN
MARKET NOW
{{ price }}
{{ change }}
Hashrate{{ hashrate }}
Fees{{ fees }}
Block{{ block }}
NEW TO BITCOIN?
Capitulation data is exactly why long-term buyers use a schedule instead of a feeling.
What is dollar-cost averaging? →
© 2026 Bitcoin Almanack
AboutFAQHow we reviewAffiliate disclosureContactPrivacyTermsNewsletterSitemap
Education, not financial advice.