Bitcoin slips under $63K as the midweek breakout unwinds
Three sessions after the CPI-driven pop to $65,225, bitcoin has given the move back — a failed test of the resistance zone traders flagged, with sentiment still pinned in extreme fear.
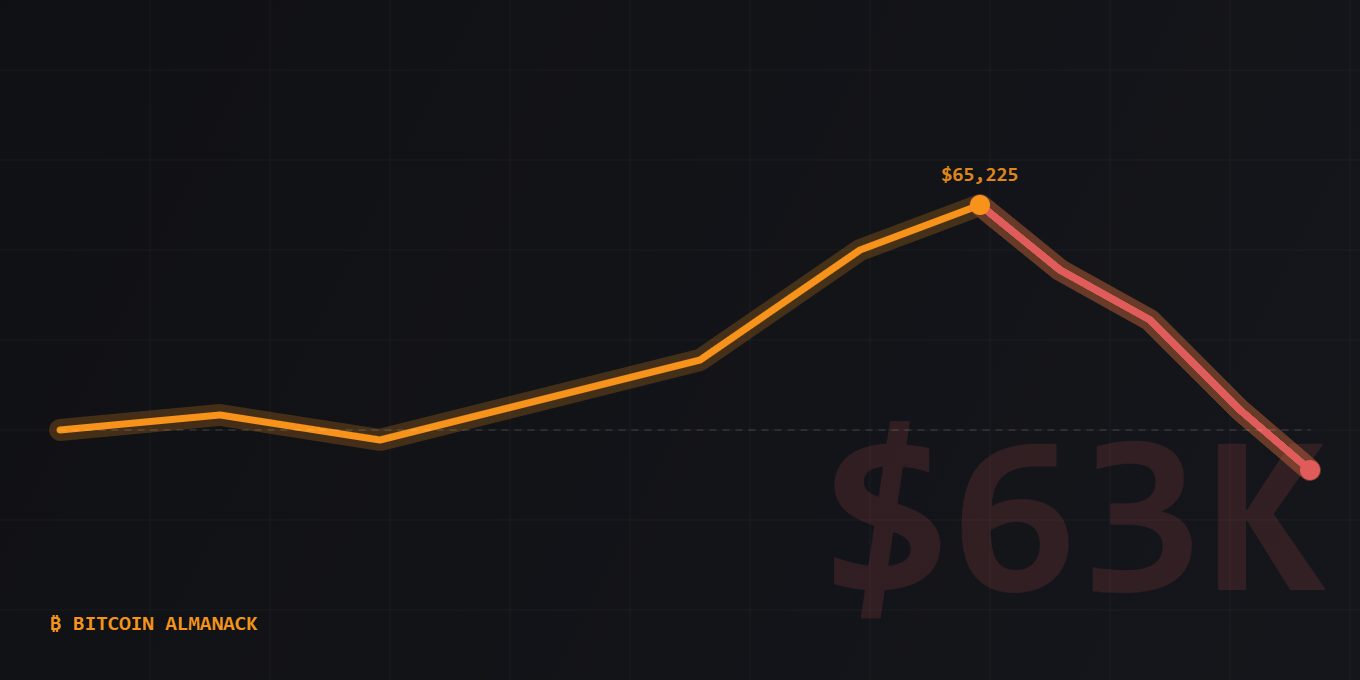
Bitcoin's round trip: Wednesday's breakout above $65,000 fully retraced by Friday morning. Illustration: Bitcoin Almanack.
Bitcoin traded near $62,800 early Friday, down about 2% over 24 hours and roughly 3.7% below Wednesday's intraday high of $65,225 — a full round trip of the CPI-driven push above $65,000 in three sessions. The breakout that briefly took a July Fed hike off the table and squeezed $1.1 billion in short positions has, for now, resolved the way most of 2026's rallies have: back into the range.
The failure came exactly where chartists said it would. The $65,000–$66,500 band — flagged as the zone that would decide breakout or rejection — turned the price back twice on Wednesday and Thursday. Volume told the same story: no follow-through bid materialized above $65,000, and spot bitcoin ETF flows stayed in July's alternating pattern, a modest inflow Tuesday giving way to outflows as the price faded.
Supply questions didn't help. Wednesday's whale awakening — roughly 5,980 BTC dormant since 2017 moving to fresh addresses — remains unresolved: no exchange deposit has been flagged, but a $383 million overhang from an unknown holder is exactly the kind of story a nervous market trades against. Sentiment gauges barely moved off the floor all week; the Fear & Greed Index sits in "extreme fear," roughly where it has spent most of the summer.
The wider frame matters more than the day. Bitcoin has spent the summer boxed between roughly $59,000 — late June's low — and $71,360, early June's high, and remains about 51% below last October's all-time high near $128,200. Inside that range, this week's move is noise with a clear lesson: soft inflation alone couldn't produce a sustained bid. Something else — a resolution on rates, a turn in ETF flows, or simply exhausted sellers — has to do it.
The institutional drumbeat, meanwhile, hasn't slowed with the price: this week T. Rowe Price became the latest trillion-dollar asset manager to launch a crypto ETF. The products keep multiplying even while the flows chop — infrastructure being built for demand that hasn't arrived yet, or has stopped leaving, depending on which side of the range you ask.
BITCOIN ALMANACK ANALYSIS
The week's round trip — and the range that contains it
$63.0KMON
$63.9KTUE
$65.2KWED
$64.0KTHU
$62.8KFRI
Approximate daily levels (intraday high shown for Wed) · Summer range: ~$59.0K–$71.4K · Data: CoinDesk, exchange feeds · Chart: Bitcoin Almanack
WHY IT MATTERS
Failed breakouts are information. This one says the market's problem isn't macro — inflation came in soft and rates are friendlier — it's conviction. Until ETF flows or on-chain accumulation show a persistent bid, rallies are being sold. For long-term holders, none of this changes the thesis; for anyone timing an entry, the range edges are doing the talking.
What to watch next
1.The $61,800–$63,000 support band. It has held since late June; losing it opens the door to a retest of the $59,000 summer low.
2.Today's ETF flow print. Friday's number decides whether this week joins the inflow column or extends the chop.
3.The whale's next move. An exchange deposit from Wednesday's awakened wallet would turn a headline into sell pressure.
Frequently asked questions
Why did bitcoin fall back below $63,000?
No single trigger — the move above $65,000 failed at the resistance zone traders had flagged ($65,000–$66,500), ETF flows stayed choppy rather than sustained, and Wednesday's $383 million dormant-whale move kept supply questions in the air. When a breakout attracts no follow-through buying, it tends to retrace.
Is this a normal move for bitcoin?
Yes. A 3–4% retracement over two sessions is routine bitcoin volatility, even in calm markets. The more telling signal is the range: bitcoin has spent most of the summer between roughly $59,000 and $71,000, and this move keeps it inside that band.
What levels matter next?
Analysts watching the chart flag $61,800–$63,000 as the support band that has held since late June, with the failed $65,000–$66,500 zone as overhead resistance. A clean break below or above either edge would signal the range is resolving.
SOURCES & DATA
CoinDesk — bitcoin price and market data ↗
Farside Investors — daily spot ETF flow data ↗
alternative.me — Crypto Fear & Greed Index ↗
Intraday figures as of ~9:45 AM ET and may move. See our editorial process.
Marisol Vega
Senior Editor, Markets & ETFs. Former ETF desk analyst; has covered bitcoin's market structure since the 2021 futures-ETF era.
MORE FROM THIS WEEK
The sellers are the faithful: two-thirds of exchange inflows are long-term holders taking a loss
ON-CHAIN
Bitcoin lands on TikTok Shop: Fold's gift card puts BTC next to the phone cases
ADOPTION
The SEC is racing Congress: three crypto rules move while the CLARITY Act stalls
REGULATION
A whale wakes after 8.5 years: dormant 2017-era wallet moves $383M in bitcoin
ON-CHAIN
MARKET NOW
{{ price }}
{{ change }}
Hashrate{{ hashrate }}
Fees{{ fees }}
Block{{ block }}
NEW TO BITCOIN?
Volatile weeks are why most long-term holders buy on a schedule instead of timing the range.
What is dollar-cost averaging? →
© 2026 Bitcoin Almanack
AboutFAQHow we reviewAffiliate disclosureContactPrivacyTermsNewsletterSitemap
Education, not financial advice.