Bitcoin's slice of the pie holds at 56% while everything else falls faster
In a week when the whole crypto market slid, bitcoin's dominance barely moved — because altcoins fell harder. What the market's oldest ratio says about where risk appetite actually is.
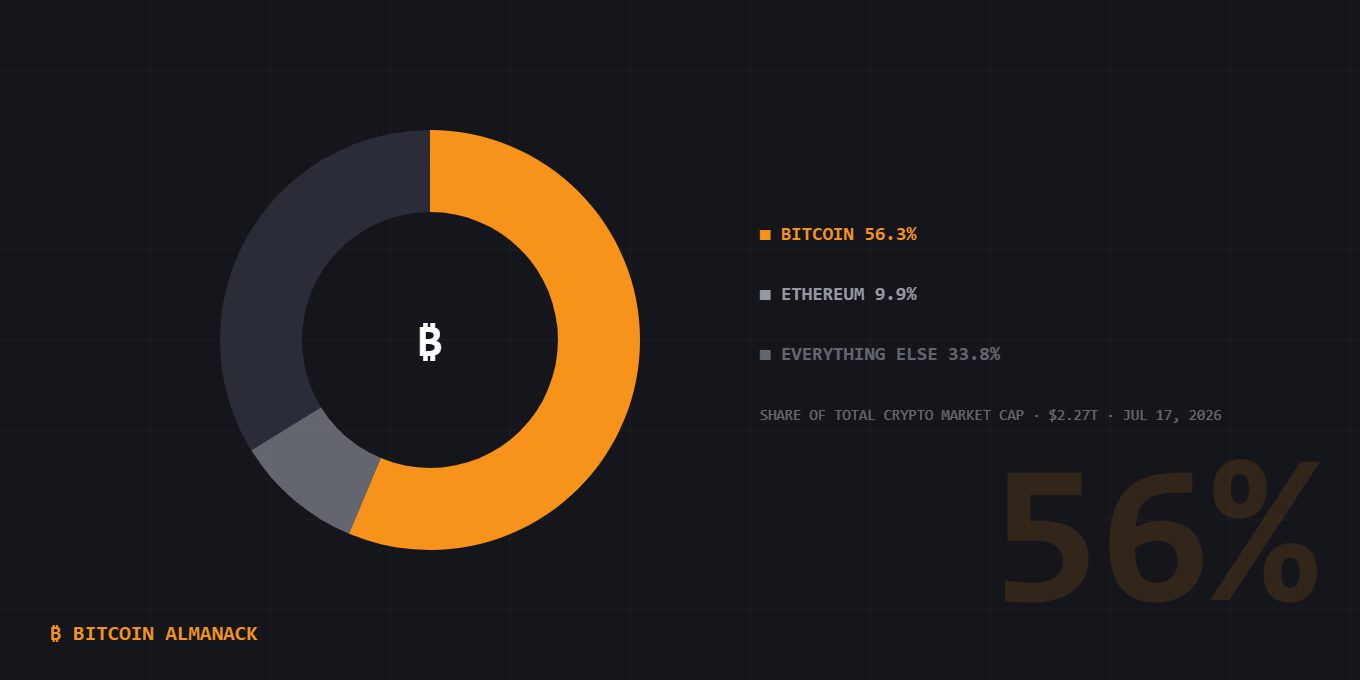
The market in one ratio: bitcoin's share of total crypto market cap, July 17. Illustration: Bitcoin Almanack.
The crypto market shrank 1.6% over the past day to roughly $2.27 trillion — and bitcoin's share of it barely flinched. Dominance held near 56.3% by CoinMarketCap's count, with bitcoin's ~$1.28 trillion market cap dwarfing second-place Ethereum's roughly 9.9%. The reason is arithmetic, not strength: in Friday's risk-off tape, bitcoin fell about 1% while ether dropped 2.4%, the same pattern that pulled bitcoin under $63,000.
That is dominance behaving exactly as it usually does. The ratio is less a scoreboard than a risk gauge: when appetite drains out of crypto, the smaller and more speculative the token, the harder it falls, and bitcoin's share rises passively. When greed returns, the flows reverse — the "altseason" trade — and dominance bleeds. This week's slide in ether, and 10% drops in newer perpetual-market favorites, did more for bitcoin's share than any bitcoin buying did.
A caveat worth naming: the number depends on who's counting. The same day this week read 56.3% on CoinMarketCap and about 60% on Coinbase — the numerator (bitcoin) is identical, but trackers disagree about which of the tens of thousands of tokens belong in the denominator, and whether stablecoins count at all. Analysts watch the trend, not the level, and the trend has been sideways-to-up all summer while sentiment sat in extreme fear.
Some chartists see the first cracks: the ETH/BTC ratio broke above a channel this week, a setup altcoin traders read as early altseason evidence. The counterargument is the tape itself — a week when even bitcoin's most patient holders are selling at a loss is a strange launchpad for a speculative rotation. Historically, dominance tops have come with euphoria, not capitulation.
For long-term bitcoin holders, the ratio is mostly a mirror of everyone else's risk appetite. It doesn't change bitcoin's supply schedule or security budget; it tells you what the marginal dollar in crypto is doing. Right now the marginal dollar is hiding in the biggest, oldest asset in the room — which is what fear looks like on a pie chart.
BITCOIN ALMANACK ANALYSIS
The $2.27 trillion crypto market, divided
BITCOIN
$1.28T
−1.0% 24H
ETHEREUM
$225B
−2.4% 24H
TOTAL MARKET
$2.27T
−1.6% 24H
Market caps and 24h changes as of July 17 · Data: CoinMarketCap · Chart: Bitcoin Almanack
WHY IT MATTERS
Dominance is the cleanest single read on crypto's internal risk appetite — and right now it says defense. A market hiding in bitcoin during a selloff is normal; the signal to watch is a sustained dominance decline without a bitcoin rally, which would mean speculative money returning before conviction money does. That's the setup that has historically preceded the frothiest — and most fragile — phases of a cycle.
What to watch next
1.The ETH/BTC ratio. This week's channel breakout either follows through — the altseason case — or fails like bitcoin's own breakout did.
2.Dominance vs. the 60% line. A push through the cycle's high ground would say fear is deepening; a rollover alongside a bitcoin rally would be the healthier rotation.
3.Stablecoin share. Dollars parked on-chain are dry powder; if the stablecoin slice grows while prices chop, buyers are staging, not leaving.
Frequently asked questions
What is bitcoin dominance?
Bitcoin's market capitalization as a share of the total crypto market's. At roughly 56.3% on July 17, bitcoin's ~$1.28 trillion accounts for over half of the ~$2.27 trillion crypto market.
Why do different sites show different dominance numbers?
The numerator is the same; the denominator isn't. Trackers disagree on which of thousands of tokens to count and whether to include stablecoins — so the same day can read 56% on CoinMarketCap and 60% on Coinbase. The trend matters more than the level.
What does rising dominance mean?
Money favoring bitcoin over altcoins — typical of risk-off periods, since altcoins usually fall harder in selloffs. Falling dominance has historically accompanied speculative "altseason" phases when risk appetite runs hot.
SOURCES & DATA
CoinMarketCap — bitcoin dominance and global market cap ↗
Coinbase — bitcoin market data (alternative dominance methodology) ↗
CoinDesk — markets coverage, July 17 ↗
Figures as of mid-afternoon ET, July 17, and will move. See our editorial process.
Marisol Vega
Markets Reporter, ETFs & News. Tracking every spot ETF flow report since the funds launched; former wire-service markets desk.
MARKET NOW
{{ price }}
{{ change }}
Hashrate{{ hashrate }}
Fees{{ fees }}
Block{{ block }}
NEW TO BITCOIN?
Dominance measures bitcoin against everything else. Start with what makes it different.
What is Bitcoin? →
© 2026 Bitcoin Almanack
AboutFAQHow we reviewAffiliate disclosureContactPrivacyTermsNewsletterSitemap
Education, not financial advice.